Deborah R. Fowler
Fractals - Mandelbrot and Julia Sets
Posted Aug 4 2015
Updated links May 13 2019
Fractals - a vast topic, this is just a brief introduction to the Mandelbrot and Julia sets in relation to assignments given in class.
Please also see the section on L-systems.
In class you may be asked to write code to produce a Mandelbrot set or a Julia Set. (Class notes pdf).
Recently I have create a version on the Mandelbrot set in a point wrangle and python in Houdini as well.
Also Sierpinski python and point wrangle (recursive and iterative).
Mandelbrot Set
Mandelbrot sets are named after the Polish-born French and
American mathematician, Benoit Mandelbrot (1924-2010). He is
recognized for coining the word "fractal" as well as developing a
"theory of roughness".
Numberphile
with Holly Krieger of MIT gives an excellent explanation
of Mandelbrot sets and moves on to the Filled
Julia Set.
The Mandelbrot Set (M) can be described by the equation:
Where c is a complex number (a + bi)
Recall a and b are real numbers and i = sqrt(-1) or i^2 = -1
In the complex plane if a + bi is plotted, a and b would be
similar to an x,y coordinate pair on a cartesian plane but now
the graph is a representation where a is the horizonal (real
numbers) and b is the vertical (imaginary) axis.
The equation above describes the Mandelbrot set (and later the
Julia set). What happens if we plug in zero on iteration? We get
c, what if c was 1. We get 1,2,5, 26 ...
f(0) = 0 + 1
f(1) = 1 + 1
f(2) = 4 + 1
f(5) = 25 + 1 and so on
The Mandelbrot set is concerned with the size of this number
(distance from the center on the complex plane). Two things can
happen:
1. gets huge (goes to infinity) - as in the case above
2. distance is bounded < 2 (and that is the Mandelbrot set) -
for example, if c was -1
So M (Mandelbrot set) is the set of complex numbers where the
second takes place. On the boundary is where it gets interesting
as small changes to c can go either way.
There is also an excellent description of Mandelbrot sets at http://mathworld.wolfram.com/MandelbrotSet.html
and an excellent exercise describing an algorithm for solving the
Mandelbrot set at https://introcs.cs.princeton.edu/java/assignments/mandel.html
"The Mandelbrot set is a specific set of points on the
plane with many fascinating properties. One can determine whether
or not a point (x, y) is in the Mandelbrot set by performing the
following calculation: start with r = x and s = y,
then enter into a loop which resets r to r*r - s*s
+ x and s to 2*r*s + y (using the old
values of r and s in both of these update
formulae). If this sequence remains bounded (neither r nor s goes
to infinity) then the point (x, y) is in the Mandelbrot set;
otherwise, if the sequence diverges to infinity, it is not. If you
plot the points in the Mandelbrot set black, and those not in the
set white, a strange and wondrous pattern emerges, roughly within
the 2.0-by-2.0 box centered at (-0.5, 0). For a more dramatic
picture, you will replace the white points with color gradations,
depending on the number of iterations needed to discover that the
point is not in the set. These colors reveal the striking detail
of the terrain just outside the Mandelbrot set ... The
mathematical definition of the Mandelbrot set is precise, but is
computationally unappealing, since we would have to perform an
infinite number of iterations to determine whether a single point
is in the set! We are rescued by the following mathematical fact:
if r*r + s*s ever gets to be greater than 4, then the
sequence will surely diverge off to infinity, and the point (x, y)
is not in the set. There is no simple test that would
enable us to conclude that (x, y) is surely in the set,
but if the number of iterations exceeds 255, the point is extremely
likely to be in the set ... The interesting part of the
Mandelbrot set occurs in a 2.0-by-2.0 box centered at (-0.5, 0.0):
the data in mand32.txt has n = 32, (xmin,
ymin) = (-1.5, -1.0), and dimension (width, height)
= (2.0, 2.0). The other data files zoom in on different regions."*
*from http://introcs.cs.princeton.edu/java/assignments/mandel.html "This assignment was adapted by R. Sedgewick and
M. Weiksner from the book A Turing Omnibus by A.
Dewdney. Modified slightly by Adam Finkelstein and Kevin
Wayne. Copyright © 2000 Robert Sedgewick
There is also excellent pseudocode given on the wiki entry:
For each pixel (Px, Py) on the screen, do:
{
  x0 = scaled x coordinate of pixel (scaled to lie in the Mandelbrot X scale (-2.5, 1))
  y0 = scaled y coordinate of pixel (scaled to lie in the Mandelbrot Y scale (-1, 1))
  x = 0.0
  y = 0.0
  iteration = 0
  max_iteration = 1000
  while ( x*x + y*y < 2*2  AND  iteration < max_iteration )
  {
    xtemp = x*x - y*y + x0
    y = 2*x*y + y0
    x = xtemp
    iteration = iteration + 1
  }
  color = palette[iteration]
  plot(Px, Py, color)
}
where relating the pseudocode this is just z = x
+ iy and z^2 = x*x + i2xy - y*y and c = x0 + iy0
so the computation of x and y (just substituting
and taking the real and imaginary parts separate creates the
code expressions x = Real(z^2 + c) = x*x - y*y + x0 and then y =
Imaginary(z^2 + c) = 2xy +y.
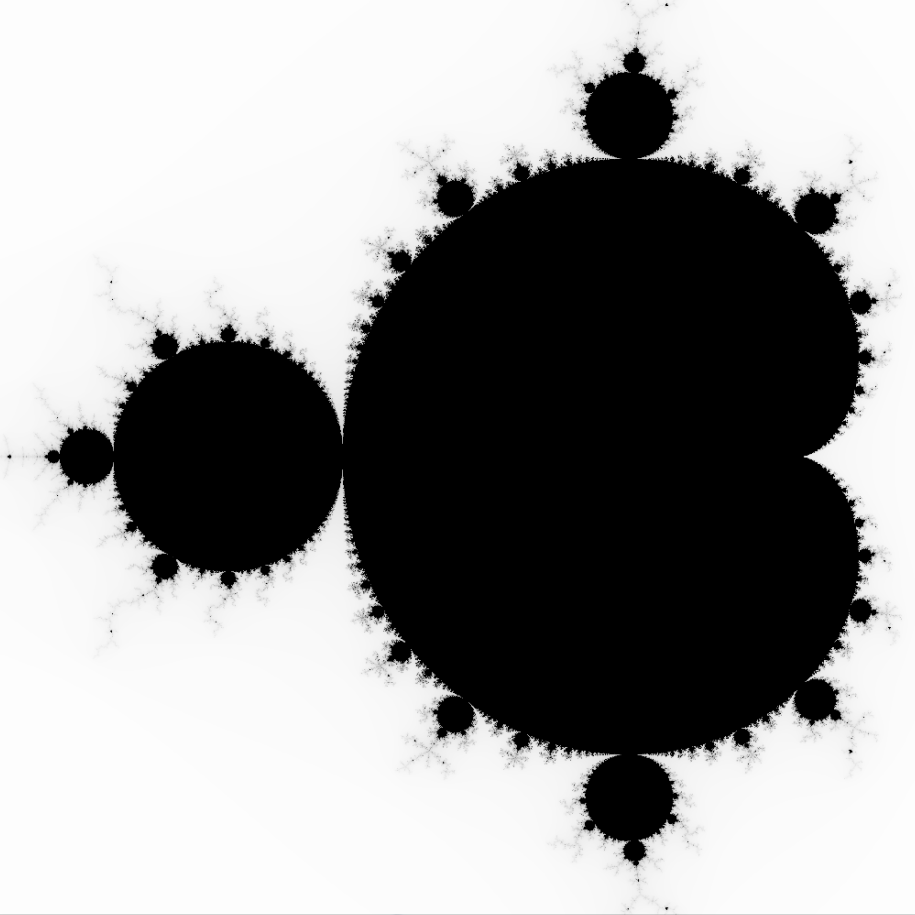
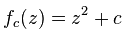
Based on the above description, I have written a simple
C++/OpenGL solution and for the color version, adapted a similar
color scheme found at
http://wojanton.ovh.org/ang/fractals/mandelbrotCpp.php (link no
longer active). Try http://warp.povusers.org/Mandelbrot/
Images here generated with 1000 iterations and threshold 4 with x
min -1.5 and 2 wide and y min -1.0 and 2 wide. (Code written in
C++/OpenGL, image result screen snaps.)
References:
http://introcs.cs.princeton.edu/java/assignments/mandel.html
http://wojanton.ovh.org/ang/fractals/mandelbrotCpp.php (no
longer active)
http://lodev.org/cgtutor/juliamandelbrot.html#Julia_Set
Interesting article about numbers in general and specifically
complex numbers at http://acko.net/blog/how-to-fold-a-julia-fractal/
Must read NOVA
presentation!
Benoit Mandelbrot's TED talk here.
Julia Set
So now the Julia set is the set of complex numbers that we don't just start iterating at zero, we start at some number. So for example, c at 0 we are bounded at disc 1. Then different c values (complex values) will define a Julia set. The Julia set can be connected or not.The values of the equation tend to be "chaotic" with small changes to c making drastic changes visually. The Julia Set was named after French mathematician Gaston Julia (1893-1978).
Here are some excellent examples of a subset using a parameteric plane of quadratic polynomials from complex c values suggested on the wiki page for Julia Set data:
Images here generated with 1000 iterations and threshold 4 with x range and y range -1.5 to 1.5
Float over image for parameters. Code written by me in C++/OpenGL as above, but modified to use specific values of c.
The algorithm is very similar to the one above, but now for specific values of c.


Below are the same patterns, but using a modified color palette as described in http://wojanton.ovh.org/ang/fractals/mandelbrotCpp.php (site no longer active)


Below are the same parameters but using a different color interpretation and data written as bmp files, not using OpenGL. The source code for the images below was written by Ali Seiffouri with minor modifications to the color palette.


There are different algorithms to solve the equation. IIM (backwards or inverse iteration), DEM/J (discrete element method), etc. The code that I have written is based on the Mandelbrot description above. There are also differing techniques to apply colors to the data as seen above.